Jump into Analytics in Dynamics 365 Customer Insights - Journeys
Dynamics 365 Customer Insights - Journeys is a tool to help you get the most out of your digital marketing campaigns and communication materials by utilizing multiple channels, audience segmentation, and triggers. This means nothing if you don’t have the necessary data to back you up. Customer Insights – Journeys features built-in analytics to help you make well-informed marketing decisions. In this blog, we will go over the analytics available by default in the app, including the cross-journey and cross-channel analytics dashboards and other areas where insights are stored, and we’ll discuss how you might use these tools to take your marketing to the next level.
Journey Analytics Overview
Journey analytics tab
First, let's explore the analytics dashboard for real-time journeys. When you first log into Dynamics 365, you will want to go to the left-hand navigation menu and find “Analytics” under the Engagement section. Once you click into the Analytics feature, you will be brought to the main journey analytics dashboard, which includes tiles, tables, charts, and graphs of various data from across your app. At first, all this may feel intimidating, but we’ll break down each element and understand how to utilize each insight.
Journey Analytics Main Dashboard
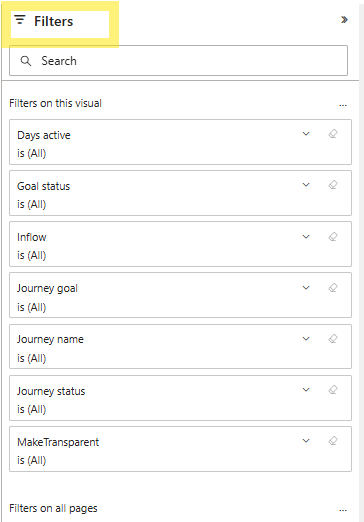
Filters
You can find a funnel icon on the analytics dashboard at the top right side of your screen, allowing you to customize your filters. There are also several filters right at the top of the dashboard, including date range, customer attributes, journey types, channels, and engagement outcomes.
The filters enable users to customize and refine the data in their dashboard to focus on the information that would be most beneficial to them. A more targeted analysis is valuable when comparing performance across different audience groups, identifying trends, and isolating the impact of a specific journey. These filters should be tailored to your needs to uncover deeper insights that will aid your analysis.
Full page filters
You can also find filters specific to each tile. If you click on the filter icon within the journey, journey goal, or any other tile, you can customize your view based on the data and analytics that benefit you the most.
Tile filters
Data within the Journeys Dashboard
Much of the data on the dashboard will revolve around customer journeys. In the Dynamics 365 app, marketing content can be sent through email, text message, or push notifications, known as ‘Channels'. We will revisit channels later, but let's continue with Journeys.
Imagine sending a marketing email out to an audience of 100 individuals. 50% of them opened your email and did not interact with it, 25% opened it and completed the action you were hoping for, and 25% didn’t even open your email. Using Dynamics 365’s built-in analytics, you can track all this information to make inferences to why this is happening. You can receive journey data that will help you make informed decisions about keeping your audience engaged by showing you why people left your journey, tracking trigger-based vs segment-based journey participation, and helping you set journey goals. Five tiles at the top of your screen are quick analytics tiles that immediately tell you key data points without diving too deep into everything else.
The tiles will show you the total number of journeys that met their goal, the email engagement rate, push notification engagement rate, text message engagement rate, and total inflow. The “Total inflow” tile tells you the total number of people who are currently inside a journey flow and moving through the journey.
Let’s examine a few key elements of the dashboard more closely and consider how you might use them to gain further insight and improve marketing effectiveness.
Journey Goals
One of the tiles on the main dashboard is journey goals. Journey goals help marketers define, track, and optimize specific business functions within customer journeys. These goals can be configured when you set up a new journey. You can even track performance by specific goals. A few default goals can be implemented in the journey: Drive a purchase, engage customers, increase loyalty, onboard new people, or even create a custom goal.
The goal-setting feature allows you to set measurable business objectives for a customer journey. You can monitor real-time purchases, event registrations, and email engagements toward your goals.
Why people left the journeys
Next, you will see a section in the dashboard titled “Why people left the journey”. In this section, you will see a graph showing how many people completed the journey and how many did not. The graph will show you where people left on the journey, and you will be able to develop a strategy to keep people on the journey until completion, allowing you to meet more of your journey goals. In some cases, someone may leave a journey early because they become a customer earlier than anticipated. If this is the case, there is still helpful information you will be able to pull, such as what journeys made them pull the trigger to become a customer.
Why people participated in the journeys
This dashboard section helps show why people participated in the journey based on certain triggers, segmentations, and conditions. Journeys are either trigger-based, meaning someone performed an action (like completing a form or making a purchase) that set them on a journey, or they are segment-based, meaning an audience member is set on your journey based on demographics, attributes, or other characteristics. This tile provides another layer of visibility into specific actions that led individuals to enter the journey, such as submitting a form, purchasing, or belonging to a target segment. This can be useful to refine your targeting strategies by comparing your segment-based journeys with your trigger-based journeys and reviewing the overall performance and engagement you receive based on these two distinct starting criteria.
Engagement
Scrolling down to the engagement sections is another important dashboard part that will help you make great marketing decisions. The engagement tiles can help you see how your audience interacts with your emails, texts, push notifications, forms, or other pathways on a journey. This section will track key metrics such as open rates, click-through rates, form submissions, and message delivery success. The engagement tool will help you determine how to best communicate with your audience based on their engagement rate. Knowing what resonates with a specific audience will allow you to fine-tune your messaging and adjust channel strategies.
Channel engagement successes
Next on the dashboard, the channel performance section does what it sounds like it does: it tracks the performance of different channels, including email, messages, etc. It will show you if the content was delivered, opened, and clicked. If you want to see if the audience clicks more on your content in an email or message form, this is where you will learn that information and adapt to your needs.
Channel engagement issues
The channel engagement issues section shows how many of your journeys failed to be delivered or were not opened. Understanding what isn’t working is important for changing your strategy and adjusting based on real data and feedback.
A/B testing
Next up is the A/B testing tile, which will prove useful if you have A/B testing within any selected journeys. Here, you’ll see which of your message variants performed the best. It will also show you which of your different channels performs the best if you want to test them against each other. A/B testing provides great insight into how best to tailor your messages to perform best with your audience.
Channel Analytics Overview
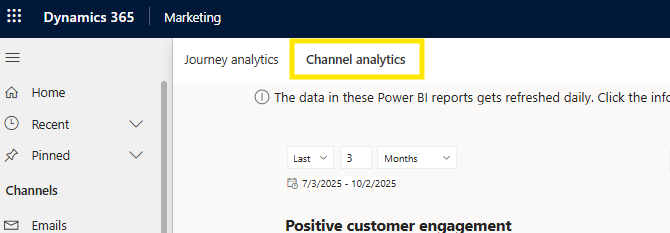
Channel analytics tab
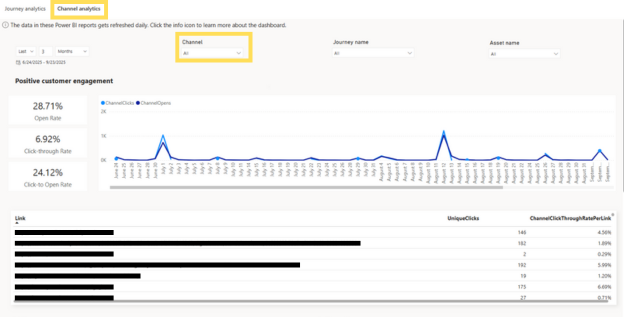
Let’s take a moment to switch to the Channel Analytics tab at the top of our dashboard. This tab shows analytics related to the different channels running through the journey, such as email, text message, or push notifications. You can filter your view to see only the data from the channel or channels you want.
This tab will also show you the open rate of each channel, click-through rate, and click-to-open rate. It will also conveniently hold the links used in your journey and have the clicks and click rate data next to their respective links. You can scroll down on the channel analytics tab and find the delivery success and delivery issues section, which will tell you messages that were sent and delivered vs. how many were blocked, hard bounced, etc.
You’ll also see a section for negative customer engagement—such as spam rates and unsubscribes—so you can monitor it closely and ensure it stays low.
Channel Analytics main dashboard
Other Insights within the app
Outside of the main analytics dashboard, there are a few other places you can get analytics from. Let’s take some time to explore those as well.
Message-specific insights
First, you can check the analytics of each message sent across your channels. This can be done by going to the “Channel” section on your screen's left side and selecting the channel where you want to check the analytics. Using the email channel as an example, click on the specific email for which you want to see the analytics. You will then be brought to a preview of the email that is ready to be sent. Under the name of your email at the top of the screen, you will see three options, with the middle one being “insights”- note that this tab will only appear if you’ve already sent this email out to at least one recipient. Once you click into that, you will see all the analytics regarding that specific email. These analytics include:
· Delivery data (delivery rate, blocked, failed)
· Interactions (open rate, click rate, click-to-open rate, marked as spam, and unsubscribed)
· Delivery trends line chart and a delivery funnel bar chart (including sent, delivered, unique opens, and unique clicks)
· Engagement trends, including total opens and total clicks
· A Click Map
· Link insights
· Open by email client
· Top devices, OS, and browsers based on clicks
· Variations (if any)
Email specific insights
Contact insights
Analytics can also be pulled for each contact. Yes, you can get data and analytics for specific individual contact. Select a contact in the audience section on the left and choose the individual you want to get data on. Under the contact's name, select “Insights,” and you can see all the data on that contact across all your channels. Stats like engagement, mentions, total clicks, total opens, and open rates will all appear and help you tailor how best to connect with this individual. If you notice the contact reengages more with emails versus text messages, you can remove him from any text message journeys and ensure he receives email marketing going forward.
Contact specific insights
Form submissions
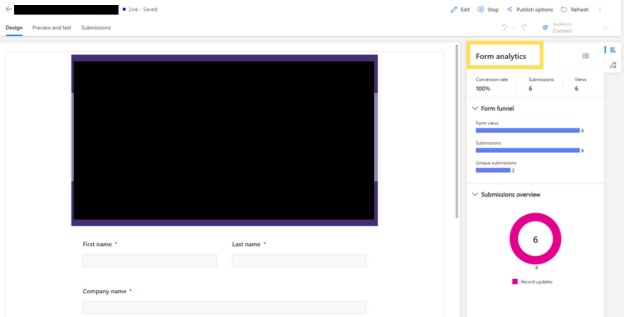
Lastly, the forms you create can also be a great way to get insight and analytics. You can learn the conversion rate, submissions, and how many people have viewed a specific form that you have sent out. This will help you understand if people are completing your forms and how beneficial they are in your marketing strategy. All you need to do to view this is go to the forms page under the channels section of Dynamics 365. Once on the main home screen of the forms, you can select any form you would want to get more insights on.
Form specific insights
Overall, the Journey analytics section within Customer Insights—Journeys is an extremely useful tool that allows you to customize your views and track the successes and failures of your campaigns in real time. For marketers, having access to reliable, actionable data is essential for making informed decisions.
Using Dynamics 365, you can leverage tailored insights that reflect your audience behavior and campaign goals. This allows you to optimize your strategies, adjust your messaging, and drive better results. Whether refining targeting, testing new channels, or evaluating performance, the analytics dashboard gives you the clarity and control to elevate your marketing.


